 ASM Lab
Results
See where the heat load lands
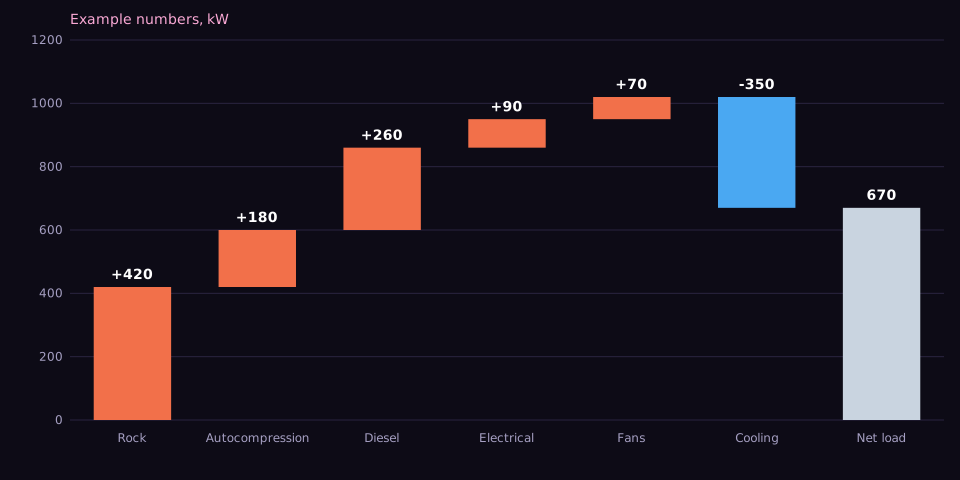
The Charts tab has a new waterfall chart. Each heat source in your solved model steps the load up: rock, autocompression, diesel, electrical, blasting and fans. Cooling steps it down. The last bar is the net heat load left in the air.
Where a doughnut shows the share of each source, the waterfall shows how they add up and how much the cooling really takes back.
What you get
- Every heat source as its own step
- Cooling shown as a drop
- The net load at the end
- Uses the results of your own solve
To know
The picture here uses example numbers, not a real mine. In ASM Lab the chart shows your own model after a solve with airflow and heat.